Data-Driven Article/Poetry
- Who: Teams of 3-4
- Objectives: Design; Social Justice
Overview
The goal of this assignment is to infuse creativity and art into our creation of interactive visualizations. We will consider the concepts of data journalism and data poetry. You will create interactive visualizations with accompanying text, with the option for this to take the form of a journalistic article, or a poem... This project will involve 6 milestones throughout the semester to build up your article or poem.
Note that every submission should include a statement about if and how AI was used to complete the given milestone.
Resources & Examples
Let the resources specific to this assignment serve as inspiration for this this project for the semester.- Data Poetry: Transforming Data into Poems; Poetry of Data, Poetry of Experience
- Visual Poetry: Would You Kill God Too?; We Ask for Fire
- Data Storytelling: Some Data Storytelling Examples; Hans Rosling: 200 Countries over 200 Years in 4 minutes; Fallen of WWII; Scrollytelling
- Data Journalism: NYT You Draw It
- Misc: I Can See Music; Listen to Climate Change
Milestone Weighting
| Weight | Description | Due Date | |
|---|---|---|---|
| M1. | 5% | Curate Data. | Jan. 29 |
| M2. | 10% | Write an Article or Poem. | Feb. 5 |
| M3. | 15% | Static Vis Design. | Feb. 19 |
| M4. | 25% | Static Vis Implementation. | Mar. 24 |
| M5. | 20% | Interactive Vis Implementation. | Apr. 7 |
| M6. | 25% | Evaluate & Report. | Apr. 21 |
Milestone 1: Curate Data
- Who: Teams of 2-3
- Deadline: January 29, 2026
Let’s start by putting the data in data-driven journalism/poetry! The goal for this milestone is to choose your dataset and get it in usable format for your project. This may involve cleaning your dataset (handling outliers, dealing with missing values, etc). Make sure to allocate time for this! There are lots of resources to locate data – check out the Resources page on the course website for some ideas.
Submission: Via Canvas.
- Link to your dataset, or the dataset itself
- Dataset description: 2-3 paragraphs describing the dataset you have chosen and how it relates to your topic. Did this data already exist, or did you have to collect it? If it already existed, who is the source of the data? What is the size of the data (rows, columns) and format (tabular, text, etc)? If and how did you manipulate the data to ensure its usability (removed missing values, corrected errors, etc.)?
Grading:
- (50%) Data completeness and cleanliness
- (30%) Dataset description
- (20%) Peer feedback (5% for completing it, 15% for your teammates' perception of your contributions)
Milestone 2: Write an Article or Poem
- Who: Teams of 2-3
- Deadline: February 5, 2026
Now onto the creative part. You will want to keep in mind at this stage that ultimately your poem or article will be presented alongside the data you curated at the last step, so it should reflect something that you can envision having data associated with it. Furthermore, remember that one goal of this assignment is to focus on social justice, so choose your topic accordingly.
In addition to your creativity, you will want to consider some different poetic and journalistic forms. While you have likely encountered poetry and journalism in the past, you may or may not have thought about the mechanics and form -- i.e., does it rhyme? Do the syllables follow a rhythm? Does it employ different perspectives or use of imagery? Consider the following resources.
- This MasterClass article very briefly covers some basics of poetic form.
- This list contains 168 poetic forms. You need not look into all of these, but it might be informative to skim for inspiration on a form that suits your goals.
Submission: Via Canvas.
- PDF of your poem or article.
- 1 paragraph reflection on your goals and any relevant artistic or journalistic inspiration
Grading: Grading of the poem or article will be based on a variation of a poetry rubric, such as the one found here from Scribd.
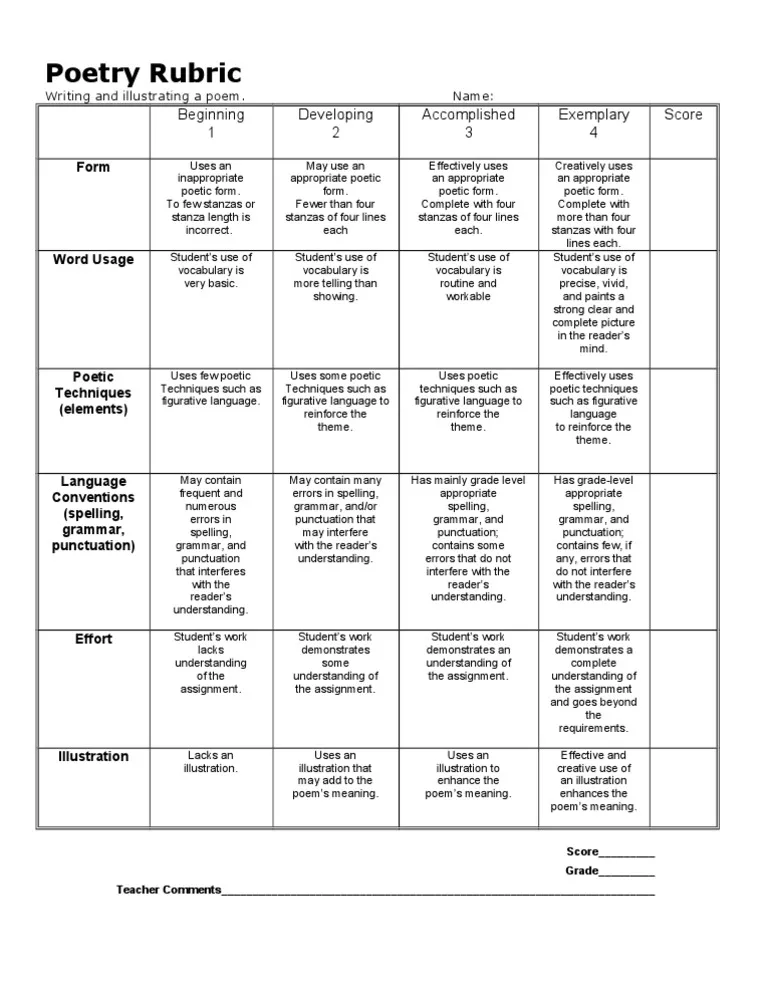
- (15%) Form
- (15%) Word Usage
- (10%) Poetic or Journalistic Techniques
- (10%) Language Conventions (spelling, grammar, punctuation)
- (15%) Creativity
- (15%) Reflections
- (20%) Peer feedback (5% for completing it, 15% for your teammates' perception of your contributions)
Milestone 3: Static Vis Design
- Who: Teams of 2-3
- Deadline: February 19, 2026
In this milestone, you will start to piece together the data and the article or poem with visualization as the connective tissue. Support your story with visualizations of the data. Try to match up frame-by-frame what a compelling or impactful visual representation might be of the data for the relevant parts of the article or poem. You may consider filtering your data to look at a specific subset, changing encodings to make a point, etc.
You should propose an infovis solution that clearly shows you have spent some time exploring the design space. To this end, you will follow the five sheet design method. Each sheet serves a specific purpose. We will spend some time in class discussing this method. Note: You do not have to use the templates that are provided, but your individual pages should contain the same general content.
Sheet 1: Brainstorming: The idea of brainstorming is to enlarge the design space of possibilities. There should be a focus on quantity – to generate as many designs as you can think of. Once you have these ideas, filter down to the most promising ones, categorize them, attempt to merge them into more powerful view combinations.
Sheets 2, 3, 4: Details for Three Separate Ideas: The three individual design sheets are to record three ideas from the initial brainstorming exercise. You should choose your three most promising ideas to expand with more detail. These include a general layout or wireframe for the visualization method, details for how the visualization system works, a description of the interactions available to the user (buttons, drop downs, query boxes, scrolling animations, etc.), and a discussion of the benefits and challenges of the chosen technique.
Sheet 5: Realization: Once you have completed your three individual designs, you need to decide on one final idea to champion. This visualization may draw primarily from one of the designs, or it may include elements from all of them. The page you will submit for this final realized design will include a list of milestones with dates - what are the big stepping stones that need to be completed for this design to be successful within the remaining semester? The page should also include some basic implementation details - what packages, software libraries, or online tutorials are you planning to rely on to build this visualization? Will you need a database connection, or will you load everything in the browser?
Resources: See the resources at the top of the page for examples and inspiration.
Submission: Via Canvas.
- PDF of Five Design Sheets
- Page 1: Brainstorming
- Pages 2, 3, and 4: Three distinct promising ideas
- Page 5: A polished sketch of your favorite idea
Grading:
- (15%) Sheet 1
- (40%) Sheets 2, 3, 4
- (15%) Sheet 5
- (10%) Document Formatting
- (20%) Peer feedback (5% for completing it, 15% for your teammates' perception of your contributions)
Milestone 4: Static Vis Implementation
- Who: Teams of 2-3
- Deadline: March 24, 2026
For this milestone, you will be building out the static implementation of your sketches and article or poem. You should implement your sketches as SVGs using D3. Importantly, you may not be just building this as you sketched in M3 – but you should incorporate feedback you received from the instructors to improve your design.
Submission: Via Canvas.
- A web accessible link to your visualization, implemented using D3.
- A link to your code repository, with a README describing how to run your code locally.
Grading:
- (30%) Vis Design: Does it adhere to best practices for the design of the system? Does it incorporate M3 feedback from instructors?
- (35%) Implementation: Does it work well?
- (15%) Format: Is the visualization accessible at a web link? Is the code hosted online?
- (20%) Peer feedback (5% for completing it, 15% for your teammates' perception of your contributions)
Milestone 5: Interactive Vis Implementation
- Who: Teams of 2-3
- Deadline: April 7, 2026
In this milestone, you should complete the final interactive implementation of your data-driven article or poem. If you are building on a complete static implementation from M4, you will be adding interactivity using D3 and/or other JS toolkits to support e.g., scrollytelling interactions.
Resources: For help on adding interactivity, refer to D3 Interaction resources.
Submission: Via Canvas.
- A web accessible link to your visualization, implemented using D3.
- A link to your code repository, with a README describing how to run your code locally.
Grading:
- (30%) Interaction Design: Does it adhere to best practices for the interaction design of the system?
- (35%) Implementation: Does it work well?
- (15%) Format: Is the visualization accessible at a web link? Is the code hosted online?
- (20%) Peer feedback (5% for completing it, 15% for your teammates' perception of your contributions)
Milestone 6: Evaluate & Report
- Who: Teams of 2-3
- Deadline: April 21, 2026
In this milestone, you will (1) evaluate your interface (extra credit) and (2) write a report about your data-driven article or poem (mandatory).
To evaluate your data-driven article or poem, refer back to the days in class we talked about evaluation. Think about what the goal of your writing is. You will first need to decide what your evaluation criteria are: what is important to assess about your design (learnability, accessibility, utility, ...)? How can you operationalize the measurement of this criteria? Revisit our lecture resources for evaluation (heuristic evaluation, usability study, etc) and decide if one of these is fitting for your evaluation goals. A good framework for thinking about this can be found in Research Contributions in Human-Computer Interaction by Jacob Wobbrock and Julie Kientz. Update: the evaluation part is now optional, for extra credit (10% boost).
Your evaluation likely involves human subjects. Feel free to reach out to friends and classmates or other potential users of your target audience. That means you should make yourself available to your classmates to participate in their evaluations. You will likely need them to participate in yours as well.
By this point in the semester, you should be able to make informed and carefully rationalized decisions about the task, target user group, number of participants, conditions, and other details of the experimental design. You will need to justify these choices in your report. When in doubt, run your evaluation ideas by me.
Submission: Via Canvas. This report will summarize your process for the data-driven article/poem assignment. The report should be a 3-5 page document that includes the following items in PDF format:
- Links to your interface on the web and the code repository
- Your article or poem
- Motivation and inspiration behind your article or poem
- Summary of dataset characteristics
- Image(s) of your interface, captioned or annotated to describe the visual representation and interaction design
- Design justification. Why did you choose the visual representation and interaction design? This should be supported by theories and best practices in academic literature.
- (optional) Evaluation design and results. What was the goal of your data-driven article or poem? How did you measure the efficacy of your data-driven article or poem? If and how did you change your design as a result?
- Reflections. Did the implementation go according to plan? Did you hit any substantial roadblocks? Did the design diverge at some point from earlier design intentions?
Grading:
- (15%) In-Class Presentation Quality
- (15%) Report formatting and length
- (30%) Report completeness and readability
- (20%) Reflections
- (20%) Peer feedback (5% for completing it, 15% for your teammates' perception of your contributions)
- (+10% extra credit) Evaluation design