CS 485/584 - Information Visualization

Synchronous Lectures T/Th 8:30a - 9:45a EST
(Fall 2021)

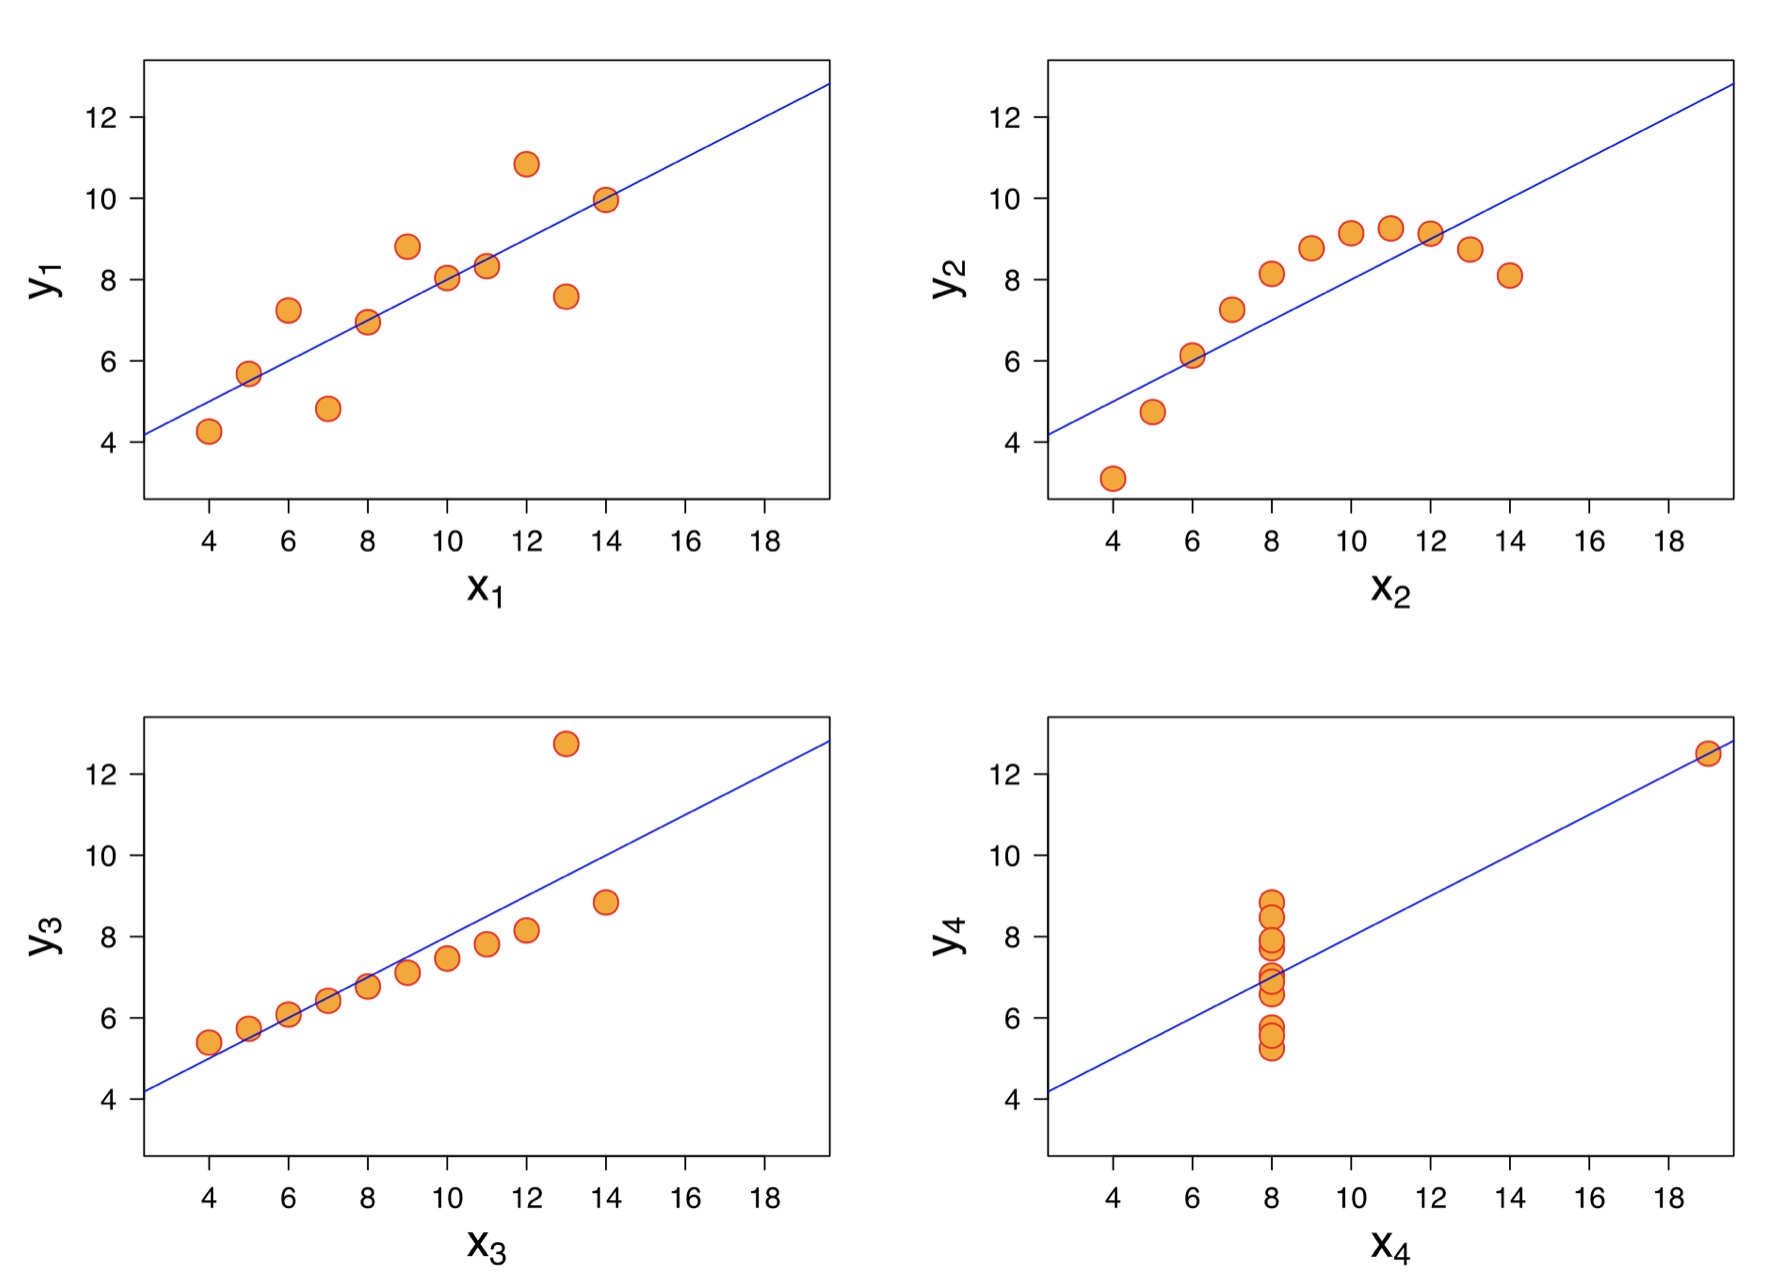
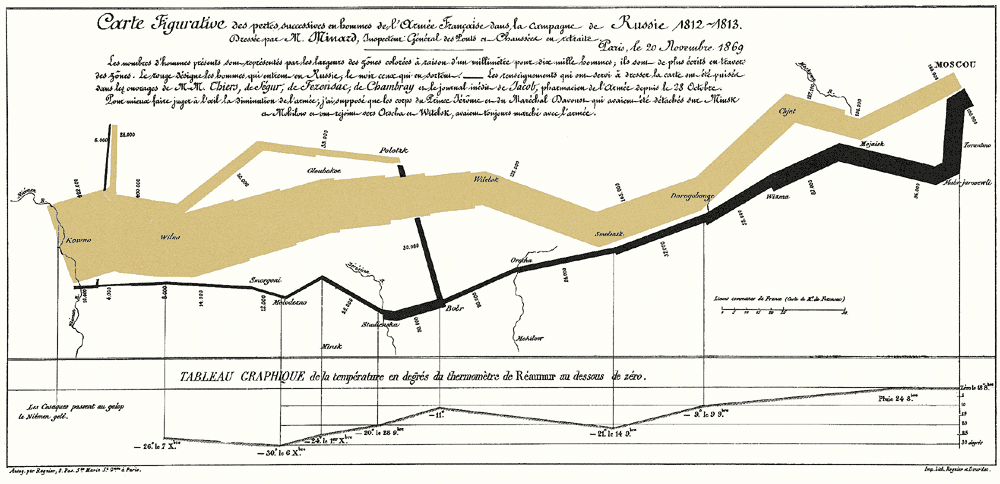
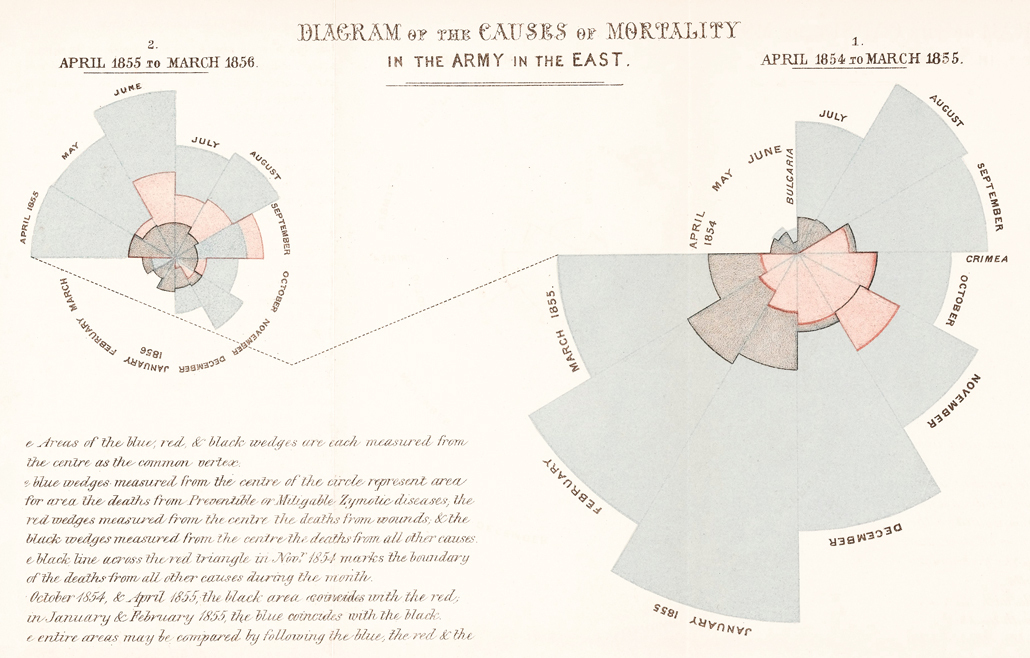
Data is everywhere, and it increasingly informs important decisions. For instance, analysis of cellphone data tracks the spread of a global pandemic, sensor data is collected and used to track and predict weather patterns, people sift through ratings and reviews to inform consumer purchases, researchers analyze patient data from medical trials to inform the success of new drugs, etc. Statistical summaries of data alone are often insufficient. People's perceptual skills allow us to see differences quickly and efficiently when data is visualized.

Furthermore, when visualization is combined with machine learning (in the form of visual analytic systems), there are dual benefits of human domain expertise and perceptual capabilities alongside machine accuracy and efficiency. In this course, students (1) will become acquainted with the fundamental theories in cognitive and perceptual psychology that drive visualization design, (2) will be introduced to the state-of-the-art in visualization research, and (3) will begin to develop the skills and proficiencies necessary to construct interactive visualizations using D3 and Tableau.

Course Logistics

When: T/Th 8:30a - 9:45a EST, synchronous
Where: Zoom
Lecture Recordings: Canvas
Assignments: GitHub Classroom
Discussion / Questions: Piazza
Office Hours: here

Your attendance is important, because we will often have exercises and discussions in-class. If intellectual stimulation is not motivation enough, part of your participation score will rely on in-class quizzes :)

Lecture Recordings Disclaimer

Our lectures on Zoom will all be recorded and made available for students who are unable to attend them live. Lecture videos posted on Canvas are for the sole purpose of educating the students enrolled in the course. The release of such information (including, but not limited to, directly sharing, screen capturing, or recording content) is strictly prohibited, unless the instructor states otherwise. Doing so without the permission of the instructor will be considered an Honor Code violation and may also be a violation of other state and federal laws, such as the Copyright Act.

Students who participate with their camera engaged or utilize a profile image are agreeing to have their video or image recorded. If you are unwilling to consent to have your profile or video image recorded, be sure to keep your camera off and do not use a profile image. Likewise, students who un-mute during class and participate orally are agreeing to have their voices recorded. If you are not willing to consent to have your voice recorded during class, you will need to keep your mute button activated and communicate exclusively using the “chat” feature, which allows students to type questions and comments live.

People

Instructor: Dr. Emily Wall is an Assistant Professor at Emory University CS. Prior to joining Emory, she was a Postdoctoral Researcher at Northwestern University after completing her Ph.D. in Computer Science at Georgia Tech.

Teaching Assistant: Shiyao Li is a first year CSI Ph.D. student. He joined Emory after completing his Masters in Data Science at Vanderbilt University.

anscombes quartet
Anscombe's Quartet demonstrates four datasets that share the same statistical summaries yet represent very different datasets.


minards map
Charles Minard's map of Napoleon's march from Paris to Moscow during the French invasion of Russia.


crimean war deaths
Florence Nightingale's visualization of causes of death in the Crimean War.

Learning Objectives

Theory

  • Students should be able to critique a visualization design.
  • Students should be able to articulate and justify their designs using concepts related to visual perception and cognition.
  • Students should be able to describe the benefits and tradeoffs of human and machine counterparts, respectively in visual analytic systems for a given design.

Design

  • Students should be able to articulate a suite of visual representations and encodings and for which data types each is suitable.
  • Students should be able to design effective static and interactive visualizations.

Implementation

  • Students should develop working proficiency in creating custom visualization or visual analytic interfaces using tools such as D3 and Tableau.

Research

  • Students should be able to describe a topic in visualization research.
  • (Graduate) students should be able to critically discuss the strengths and weaknesses of a visualization research paper.

Engagement

  • Students should engage in discussions and activities in-class and online.

Assignments & Grading

Complete assignment descriptions are available on GitHub Classroom. All assignments are due at 11:59pm EST on the due date.


Homeworks (30%)

There will be 7 homework assignments HW throughout the semester. These assignments are to be completed individually.


Group Project (40%)

Build an interactive visualization from scratch. There will be 5 project milestones M throughout the semester.

Weight Milestone Description
1. 5% Project Pitch. A short 2-minute in-class description of your project idea (dataset, why it's interesting, etc) along with a short (250-500 word) written accompaniment, to help students identify potential projects of interest and teammates.
2. 15% Short Project Statement. Turn in a written document (800-1200 word) describing the data and domain and possible tasks your visualization might support, along with some evidence of having explored relevant previous work.
3. 25% Project Design Document. Turn in sketches from brainstorming, along with a digital poster of your most promising design for feedback in a poster session.
4. 10% Status Update. Turn in a short (250-500 word) written document describing current project status.
5. 45% Final Deliverables. Turn in final code, short video figure, and written summary and reflections.

Virtual Research Presentation (20%)

What does research in information visualization look like? For this assignment, you'll sign up for a short virtual presentation on a paper of your choice from IEEE VIS.

Part 1 (All): Create a slide deck to summarize a research paper in 10-12 minutes. You will submit a recording of your presentation on Piazza, where your classmates can respond and discuss. Some questions that will be valuable to think about include: What is the motivation for the problem that the paper addresses? What methodology or approach did the researchers use? What was the result or contribution? In addition, think about how this paper fits in the context of the other course content we have covered. How does it relate to other topics we have discussed? End your presentation with a question or two to spark discussion on Piazza about the topic.

Part 2 (Graduate Students Only): In addition to describing the content of the paper, take an additional 2-3 minutes and describe your critique of the research presented. What was done well? What could have been improved? Do you have any critique of the methodology? Was the analysis sound? Did the authors appropriately contextualize their findings or overly generalize? What would be a reasonable next step if you were to expand on this idea?

For everyone else, think about the research that is presented to you. What questions are you left with? What did you think? What was done well? Respond to your classmates' posts with your impressions throughout the semester (respond to at least one post per week). In addition to participating in discussion on Piazza, part of your grade will be based on providing peer feedback to each other student.

Tips: Watch some of the videos that summarize papers here (2019 VIS previews) for inspiration. Keep in mind that these are mostly 3-5 minute videos. Your presentation in class should include greater detail. Use the aforementioned videos for inspiration; however, your presentation should not involve you playing back the video. Feel free to include graphs or figures from the paper to support your explanation.

View the schedule of presentations here. The schedule will be populated based on balancing your preferences in the course survey you will complete on Day 1. Note: You must get approval for your chosen paper -- see me after class or email me.

Grading will be based on [10%] problem motivation, [10%] methodology, [10%] contributions, [15%] connection to course content, [20%] discussion questions, [15%] presentation visuals, [10%] presentation clarity, and [10%] peer feedback.


Participation (10%)

Data visualization is driven by both theory and design. As a result, some aspects are objective, while others are aesthetic (and thus somewhat subjective). Participating and engaging with the course content is important to develop both objective and subjective skillsets. Participation will involve a two components:

Quizzes: There will be several quizzes in-class throughout the semester. Each quiz will be one question, based on a concept from the lecture. Don't panic -- these are not intended to be trick questions. Each quiz is graded on a two-point scale: 1 point for attendance, 1 point for the correct answer.

In-Class Exercises & Online Discussions: Throughout the semester, there will be a number of in-class exercises, including design activities, discussions, etc. Some of these will involve turning in an artifact (e.g., a sketch) at the end of class. Part of your Participation grade will depend on turning something in. In addition, some discussions will take place online via Canvas. Ask and answer questions to help your classmates, give feedback on posted content, etc. Don't worry, there will be plenty of content to engage with (some exercises will be posted for discussion online rather than in-class). This component of your Participation grade will depend on once weekly engagement online.

Schedule

O = Optional Reading Ø No prep = No Preparation Break = No Lecture HW = Homework M = Group Project Milestone Flex = Flex Day

Week Date Topic Reading Assignments Due
1 8-26 Introduction to Information Visualization The Value of Information Visualization, Fekete et al
O Using Vision to Think, Card et al.
Complete Background Survey
O HW0: Web Development (optional)
2 8-31 Data The Eyes Have It, Shneiderman
9-02 Charts & Visual Encodings
Guest Lecture: Dr. Cindy Xiong, U. Mass - Amherst
A Tour Through the Visualization Zoo, Heer et al.
O Stephen Few Article
O Rippin' the Rainbow a New One
Check out your assigned date for the Research Presentation
3 9-07 Perception Perception in Visualization, Healey HW1 Design Static Visualizations
9-09 Tools of the Trade: D3
Work on HW2 in class
D3, Bostock et al.
O D3 Bar Chart Tutorial Video
O Web Programming Tutorial (if you are not already familiar)
4 9-14 Communication & Storytelling TED Talk, David McCandless HW2 Implement a Bar Chart
9-16 Group Project Pitch & Group Formation Ø No prep M1 Project Pitch
5 9-21 Interaction In Defense of Interactive Graphics, Aisch
O The death of interactive infographics, Baur
9-23 Visual Analytics Why Visual Analytics
6 9-28 Data & Visualization Ethics
Part I
Dear Data
Lies, Distortions, and Misrepresentations in Data, Michael Correll
O Data Feminism, Lauren Klein
HW3 Implement an Interactive Network
9-30 Data & Visualization Ethics
Part II
ProPublica Article, Larson et al.
O Hidden Brain w/ Daniel Kahneman
M2 Short Project Statement
7 10-05 Design Principles O What Makes a Visualization Memorable, Borkin et al. HW4 Design Ethical Visualizations
10-07 Exploratory Data Analysis Skim Resources on Tableau
8 10-12 Break Fall Break Ø No prep
10-14 Uncertainty & Animation
Guest Lecture: Dr. Yea-Seul Kim, U. Wisconsin
The Visual Uncertainty Experience, Jessica Hullman
O When(ish) Is My Bus, Kay et al.
O Hypothetical Outcome Plots, Hullman et al.
HW5 Conduct Exploratory Data Analysis with Tableau
9 10-19 Evaluation
Part I
Multi-Dimensional In-Depth Long-term Case Studies, Shneiderman and Plaisant
10-21 Evaluation
Part II
A Heuristic Approach to Value-Driven Evaluation of Visualizations, Wall et al. HW6 Critique a Visualization
10 10-26 No Lecture (VIS Week) Ø No prep
10-28 No Lecture (VIS Week) Ø No prep
11 11-02 Design Lab
Maps & Networks
Ø No prep HW7 IEEE VIS Travel Report
11-04 Networks & Trees A Visual Bibliography of Tree Visualization, Schulz
Graphiti, Srinivasan et al.
12 11-09 Group Project Poster Session Ø No prep M3 Project Design Document
11-11 Tables & Text Lineup: Visual analysis of multi-attribute rankings, Gratzl et al.
O Jigsaw, Stasko et al.
13 11-16 Tasks & Visualization Models Knowledge Generation Model for Visual Analytics, Sacha et al.
11-18 Maps
Guest Lecture: Dr. Alex Godwin, American U.
Skim Tableau GeoVis Primer
14 11-23 CANCELED Enjoy the holiday
Time Series
Streamgraphs, Schwabish and Pazos
EventFlow, Monroe et al.
M4 Status Update
11-25 Break Thanksgiving Ø No prep
15 11-30 VIS Research Flash Talks
Guest Speakers: Shiyao Li,
Yanan Da, and Ziwei Dong
Ø No prep
12-02 Group Project Presentations Ø No prep
16 12-07 Group Project Presentations Ø No prep
12-10 Flex (Final Exam period: 8:00a - 10:30a) Ø No prep M5 Final Deliverables

Resources

Technology Requisites

D3

Tableau (free version available via Tableau for Higher Education)

Github

Optional Resources


Programming

D3: Examples; Tutorials; Documentation

Front-end Web Stack:
Tutorials: From Tamara Munzner's VIS Course
HTML: Mozilla Dev Network
CSS: Mozilla Dev Network; CSS Zen Garden
SVG: Tutorial
Javascript: Mozilla Dev Network; Javascript Garden; Eloquent Javascript; Design Patterns
Javascript Frameworks: React; Vue
Syntax Alternatives: Typescript

Other Vis Toolkits: Vega; Vega-Lite; P5.js and Processing; Matplotlib and Seaborn (for Python); GGPlot2 (for R)

Github: Tutorials

Web Scraping: Beautiful Soup (Python)

Systems, Data, Colors, etc.

Systems: Tableau; Spotfire; Qlik

Data: Census.gov; Data.gov; Tableau Data; /r/opendata; Quandl; Metro Boston Data Common; CDC; Real Climate; UK Office for National Statistics; World Bank Data Catalog; Basketball; UN Data; WHO Data; OECD Stats

Color: Color Brewer 2.0; 0 to 255

Example Visualizations: Data Visualization and the Modern Imagination; Baby Name Wizard

Document Scanning: CamScanner (useful for scanning in paper sketches to submit assignments online)

Policies

Timeliness

All assignments are due at the start of class on the day listed in the schedule. You will have a total of 3 “free” late days to use for any homework assignments as needed throughout the course (e.g., you can use 1 late day for HW1 and 1 for HW3, …). These "free" days can apply only to homework assignments and cannot be used for research presentations or group projects. These are for any cases where Institute-approved absences do not apply, and no reason must be given to use them. After the 3 “free” late days are used up, any late assignments will receive a 10% per day penalty. Assignments turned in one week or later past the due date will not be graded and given a 0. Note that you have to clearly note on your assignment if you want to apply your late days. This has to be done at the time of submission, not later in the course. Once you use them, you cannot switch them later in the course, so plan wisely.

Academic Honesty

Emory aims to cultivate a community based on trust, academic integrity, and honor. Students are expected to act according to the highest ethical standards. For information on Emory’s Honor Code, please visit here.

Any student suspected of cheating or plagiarizing on a quiz, exam, or assignment will be reported to the Office of Student Conduct, who will investigate the incident and identify the appropriate penalty for violations.

Unless explicitly stated otherwise, you are expected to complete assignments on your own. It is appropriate to discuss your ideas with others to gain feedback and help with sticky problems. It is not appropriate to find an existing solution online or from your friends, modify them, and submit as your own work. If in doubt, confer with your instructor. It is much easier to ask about these things than handle the consequences of a poor decision.

Regrade Policy

You can request a re-grade of an assignment within seven days of releasing the grade by sending an email to the course staff. The request should contain a written explanation of why you think that the grade is incorrect. We will look over your work again upon request. If we spot errors in grading, we will fix the error. This may end up assigning a lower score than the original if we find additional errors.

Student Support Services

In your time at Emory, you may find yourself in need of support. Here you will find some resources to support you both as a student and as a person.

Office of Accessibility Services

Your success in this class is important to me. We all need accommodations because we all learn differently. If there are aspects of this course that prevent you from learning or exclude you, let me know as soon as possible. Together we'll develop strategies to meet both your needs and the requirements of the course.

I encourage you to visit the Office of Accessibility Services to determine how you could improve your learning as well. If you need official accommodations, you have a right to have these met. Students must renew their accommodation letter every semester they attend classes. Contact the Office of Accessibility Services for more information at (404) 727-9877 or email at accessibility@emory.edu. Additional information is available at the OAS website.

Contact

Instructor: Dr. Emily Wall

emily.wall@emory.edu

Virtual Office Hours: Th 9:45am-10:45am (right after class, or by appointment) via Zoom

emilywall.github.io

Teaching Assistant: Shiyao Li

shiyao.li@emory.edu

Virtual Office Hours: F 10am-11am EST (or by appointment) via Zoom

shiyaol.github.io